
Review content performance
Compare connected social accounts by date and account, then find strong content and publishing times.
Open this feature1. Choose an account to analyze
Open “성과” (Performance) → “콘텐츠 성과” (Content performance) in the left menu. Data appears after at least one social account is connected. If none is connected, use “연결된 계정이 없습니다” (No connected accounts) → “계정 연결하기” (Connect account).
Choose “모든 계정” (All accounts) or one account in the first selector. All accounts reveals the overall channel trend, while one account is better for diagnosing posts and follower changes on a platform. In “계정 지표” (Account metrics), “총계” (Totals) is the selected-period sum and “평균” (Averages) is the per-post average, so use averages when posting frequency differs.

2. Set the date and comparison
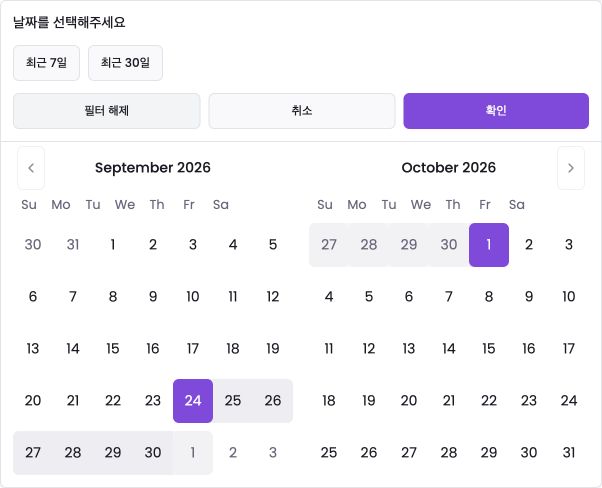
Select “최근 7일” (Last 7 days), “최근 30일” (Last 30 days), or choose start and end dates, then select “확인” (Confirm). “필터 해제” (Clear filter) removes the date selection. For accounts that post infrequently, use a longer range such as 30 days to reduce one-post noise.
Open “비교 없음” (No comparison) to choose “이전 기간” (Previous period), “전년 동기” (Year over year), “전월 동기” (Month over month), “전주 동기” (Week over week), or “사용자 지정” (Custom). Change rates also depend on post count and mix, so compare post counts, totals, and averages across both periods.
3. Change the metric and chart
Choose “노출 지표” (Visibility), “좋아요” (Likes), “댓글” (Comments), “리포스트” (Reposts), “공유” (Shares), or “인용” (Quotes). “차트 유형” (Chart type) switches between line, bar, and area without changing the underlying values. Select a daily point or bar to inspect that day's content.
“내보내기” (Export) → “CSV로 내보내기” (Export as CSV) downloads data for the current account and period. Detail analytics and export may depend on your plan. With one account selected, “분석 리포트” (Analytics report) is available, but its confirmation states that it uses 5 credits.
4. Interpret visibility and engagement rate
“노출 지표” (Visibility) unifies each platform's representative exposure value. Mirr prioritizes reach for Instagram, impressions for X and LinkedIn, and views for Threads, TikTok, and YouTube, then uses a platform-specific fallback when that value is unavailable. A multi-platform total is therefore directional exposure scale, not an exact like-for-like comparison.
The dashboard engagement rate is (likes + comments + reposts + quotes) ÷ visibility. A small denominator can make a few engagements produce a large rate. Shares are available as a separate metric but are not included in this engagement-rate formula.
5. Analyze trends, account metrics, and followers
Use “성장 추세” (Growth trend) for daily movement and switch Linear/Log when values differ greatly. “주요 지표” (Key metrics) shows totals and comparison changes; “계정 지표” (Account metrics) places post count, total, and average side by side. A high total with a low average may reflect posting volume, while a high average from few posts needs replication.
“팔로워 성장 및 노출 지표” (Follower growth and visibility) combines collected follower history with content visibility. If a platform API does not provide historical followers, profile views or clicks, conversion data, or demographics, a related card may be empty or marked unsupported. Check support and the collection period before treating zero as actual zero performance.
6. Find strong times and high- or low-performing content
“성과가 좋은 시간대” (Best-performing times) and “성과가 좋은 요일” (Best-performing days) show the selected metric's per-post average, number of posts, and total. A leading average based on one post is a small sample; look for a time repeated across several posts before changing a schedule.
Compare “최고 성과 게시물” (Best-performing posts) and “최저 성과 게시물” (Worst-performing posts) from the same period. Record repeatable differences such as topic, opening line, format, length, and posting time. Ask “AI 인사이트” (AI insights) questions grounded in current data. If an action shows a credit notice, review the cost before proceeding.
Troubleshooting
If there is no data, check the connected account, selected account, and date range, then expand the range to include recent posts. A newly connected account may not have data from before collection began.
If platforms differ sharply, identify whether each visibility value is reach, impressions, or views and compare common actions too. If follower or demographic cards are empty, check platform support and collection time; do not read an unsupported value as zero performance.
If a comparison rate looks extreme, inspect the baseline and post count, then use totals and averages together. If export or detail cards are absent, check your plan. The current screen supports CSV export.